Tutorial 1 - Introduction
1 Binderhub and RoboKudo
In this tutorial series you will get to know the basic concepts behind the RoboKudo framework. RoboKudo is a framework for robotic perception processes such as recognizing objects, their properties and more. This introduction will explain the basic vocabulary used for RoboKudo. The tutorials are based on a binderhub image that contains a jupyterlab workspace. Everything needed for RoboKudo to run is already setup in the image and all required processes are also already running when entering the notebook.
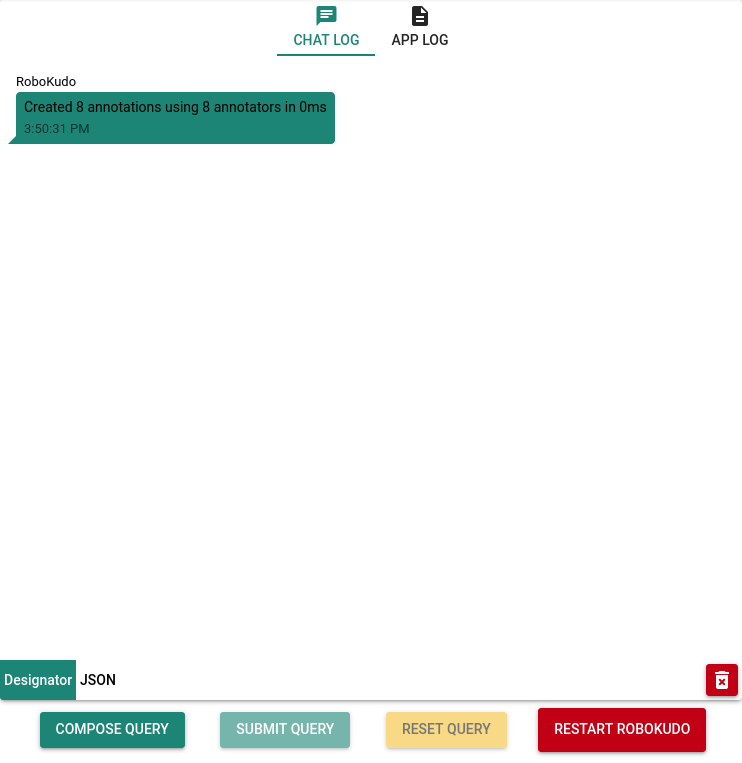
The main interaction with RoboKudo happens through a webinterface called RoboKudo Webexplorer. It can be seen in the top right pane. It will be explained in more detail in the following sections of this introduction. The most important part to remember for now is that when changing the code of RoboKudo, it needs to be restarted. This can be done through the Restart RoboKudo button in the webinterface. All tutorials of this series can be found in the vertical split on the left. Below it there are some terminals, which might be useful later.
Task 1-1: Find the Restart RoboKudo button, restart RoboKudo and wait for it to fully start up again.
2 RoboKudo Webexplorer
The RoboKudo Webexplorer used in these tutorials visualizes the basic components of RoboKudo and can be seen in the image below. These components and the concepts behind are explained in more detail in RoboKudo Introduction. Because a basic understanding about them is important for following this tutorial series, please read the RoboKudo Introduction first.
Task 2-1: Get to know RoboKudo concepts by reading the RoboKudo Introduction.
The RoboKudo Webexplorer interface is split into three larger sections as described in the following.
2.1 The “Perception Pipeline Tree” Section
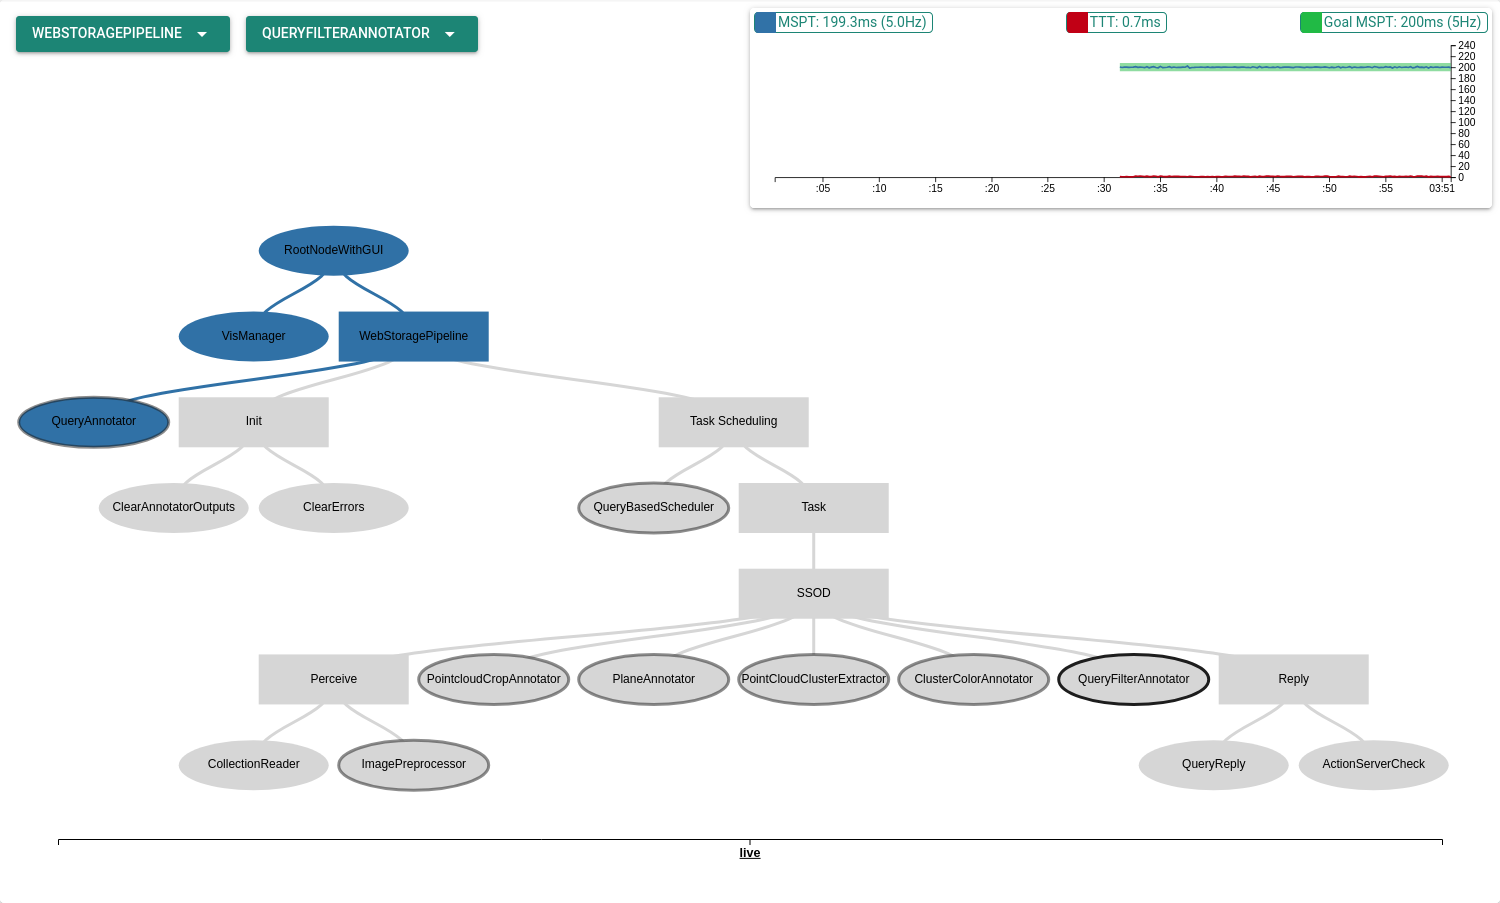
The PPT section can be seen below. It contains an overview of the current PPT used by RoboKudo visualized as a tree. Each Annotator in the PPT is represented by an oval shape. The rectangles represent sequences of these annotators. Sequences can be toggled away if wanted by left-clicking them. Annotators with a grey outline provide an output to the CAS that will be explained later. The annotator with the black outline is currently selected and its output will be shown in the CAS Section. A graph can be seen above the PPT that shows health information about it. This can be useful to measure RoboKudo’s performance during task completion.

Task 2.1-1: Toggle away the Sequence called Base.
Task 2.1-2: Select the Annotator called PointCloudClusterExtractor.
Task 2.1-3: The Type of a Sequence is Sequence, determine the Type used by Annotators. You can hover over a node in the tree to get information about it.
2.2 The Query Interface Section
The query interface section can be seen below. It contains a log of past interactions with RoboKudo and a few buttons. These buttons can be used to send Perception Tasks to RoboKudo, that specify what it should look for in the input data. The task might also be used to parametrize the various annotators of a pipeline. In the “App Log” section, you can see print statements done by RoboKudo.

Task 2.2-1: By clicking on “COMPOSE QUERY”, create and send a task to RoboKudo with the type detect.
Task 2.2-2: Determine the highest TTT and MSPT values during the processing of the query using the health graph.
Task 2.2-3: Determine how long the query took in total.
Task 2.2-4: Step through the changes using the timeline under the PPT, while doing so, determine which leaf color in the PPT corresponds to which state
Remark: The TTT and MSPT values are important if you are designing a system with realtime and/or reactivity constraints. High tick times indicate that certain nodes in the tree are consuming too much time and therefore reduce reactivity.
2.3 The CAS Section
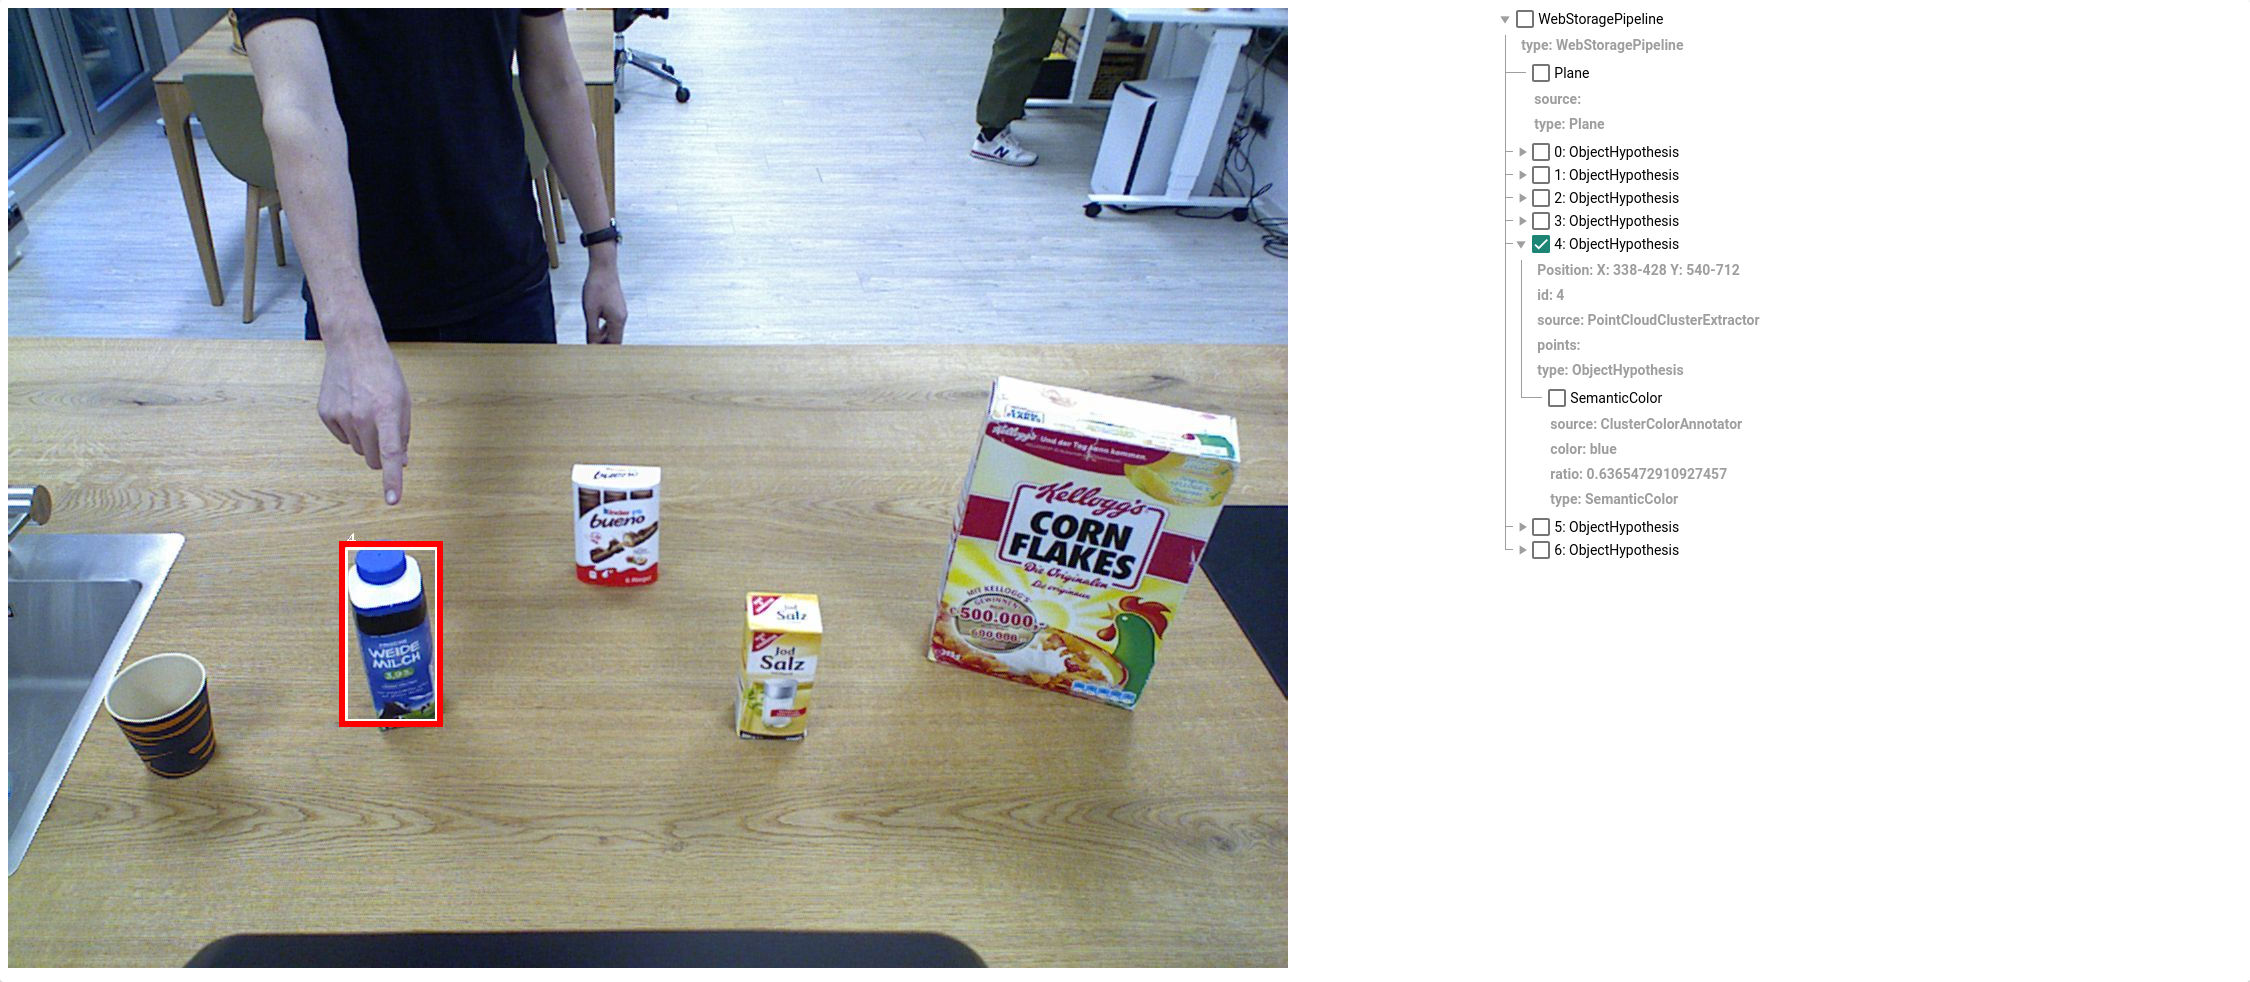
The Common Analysis Structure section can be seen below. It visualizes the Annotations done, as you can see below in the right pane. By clicking on the Annotator nodes in the PPT, you can also see their visual outputs. This is usually a visual feedback for the developers of the system to verify the results of each Annotator.

Task 2.3-1: View the outputs of PointCloudCropAnnotator and PointCloudClusterExtractor.
Task 2.3-2: Hover over an object in the output image and determine its Source annotator.
Task 2.3-3: Select an object in the output image.
Task 2.3-4: De-select and select the object in the output image and find the related ObjectHypothesis in the details tree on the right.