Tutorial 2 - Using Annotators and Pipelines
The current pipeline used by RoboKudo is rather simple to illustrate the basic idea.
In this tutorial you will learn how to add an Annotator to the PPT.
To do this, some knowledge about the RoboKudo codebase is required.
Generally the source code for RoboKudo is located in the folder src/robokudo/robokudo/src/robokudo,
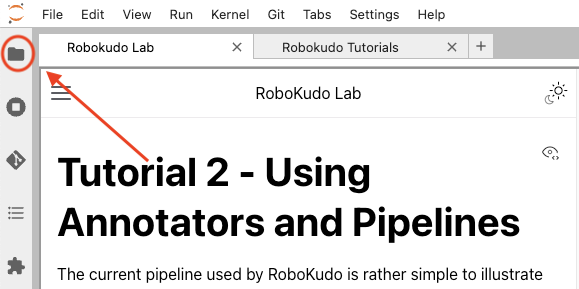
which can be accessed through the folder view on the left.

For this tutorial only the annotators and descriptors/analysis_engines folders are
required in this directory.
The folder descriptors/analysis_engines contains the various Analysis Engines (AEs).
Analysis Engines can be seen as a collection of PPTs, but they can also just
contain the definition of a single PPT.
The annotators folder contains the various Annotators used in RoboKudo.
Task 2-1: Take a look at the implementation of the AE called
web_from_storage_binder.pyin respect to the following questions:How are Annotators added to the PPT?
How are Annotators imported to the AE?
How are Sequences created?
How are Sequences added to the PPT?
Task 2-2: Add the Annotator called ClusterColorAnnotator to the end of the
object_detectionSequence. Then:Restart RoboKudo
Send query with of type detect
View output of the newly added Annotator
Important
A pipeline should contain the Sequences base_tree as the first member and
reply_tree as the last member. base_tree contains annotators
for reading in image data and perception tasks and the reply_tree is
responsible for returning perception task results and cleanup processes.
Important
If we ask you to change the AE or PPTs in the following tutorials, always refer to web_from_storage_binder.py unless noted otherwise.
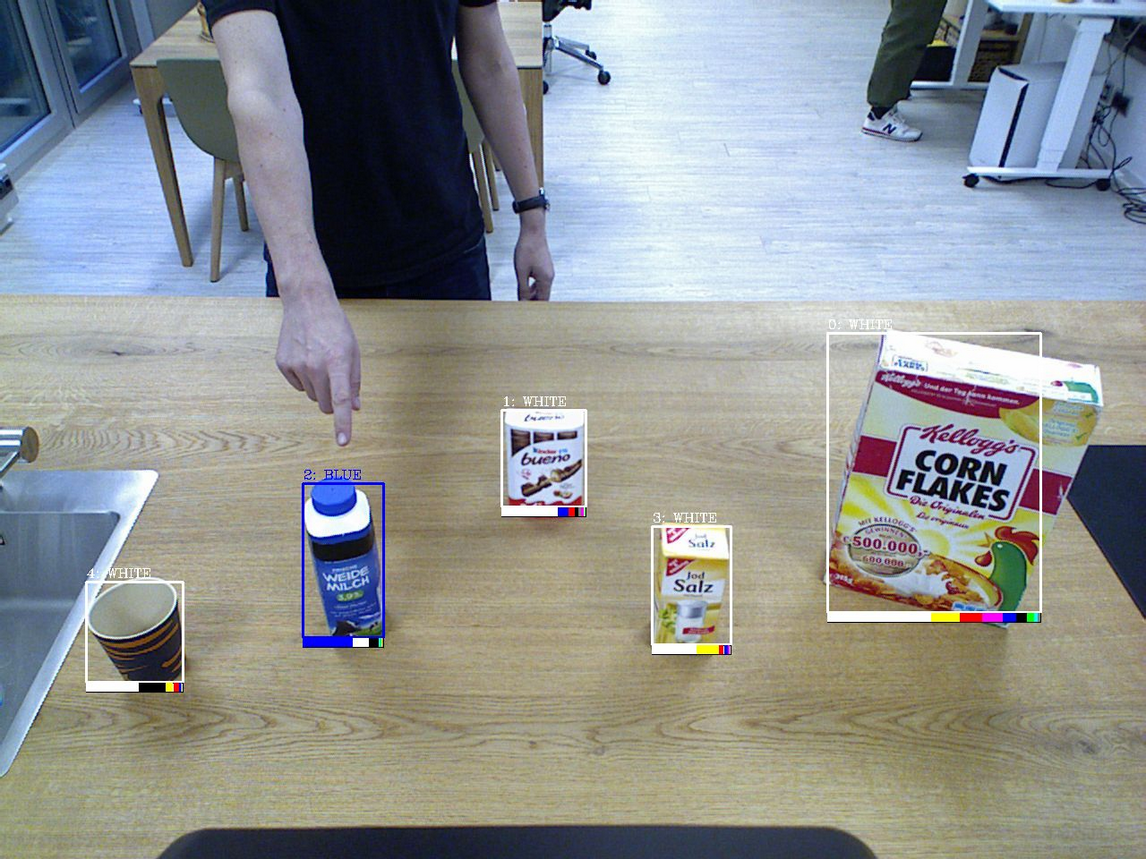
Now that you have added the ClusterColorAnnotator to the PPT, it should be able to recognize the dominant colors of detected objects. This should also be visible in the output image of the annotator. The output of it should look something like this:

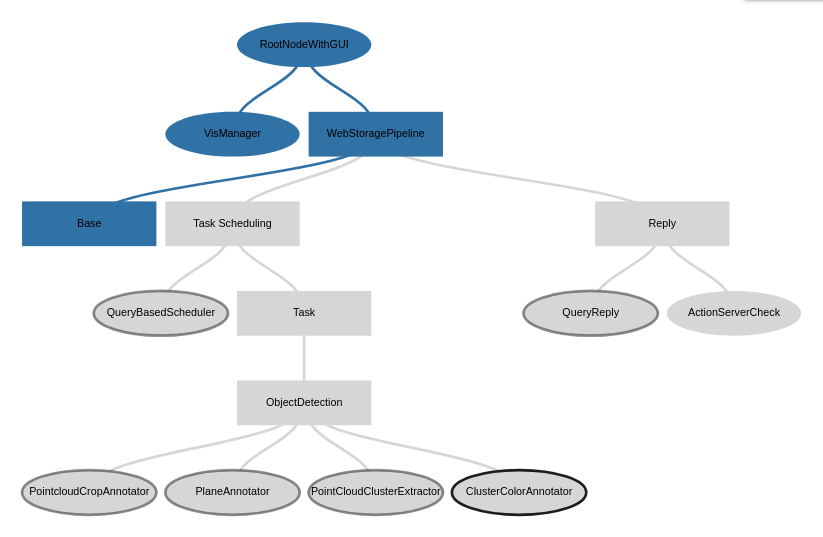
If you have completed the task correctly your PPT should look something like this:

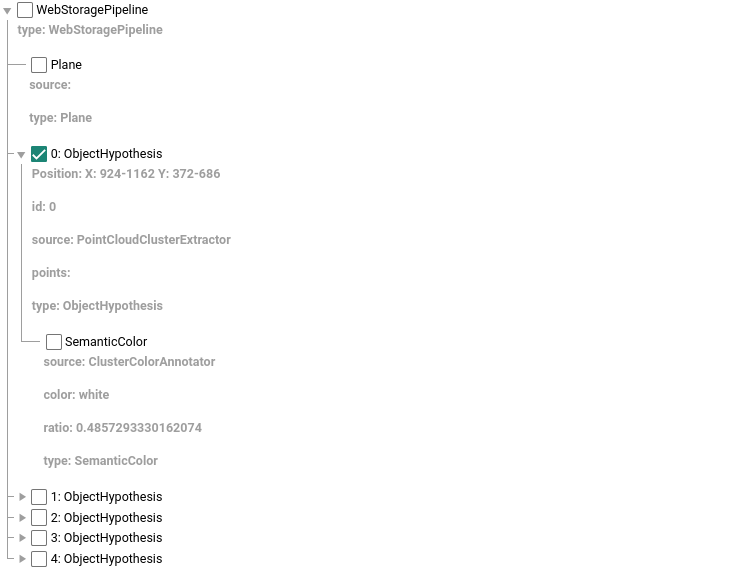
When hovering over an object in the details tree next to the output image you should also be able to see the annotations that were added to the ObjectHypothesis called SemanticColor. As an example:

The final sequence could look something like this:
object_detection = py_trees.Sequence("ObjectDetection")
object_detection.add_children(
    [
        PointcloudCropAnnotator(descriptor=pcc_descriptor),
        PlaneAnnotator(),
        PointCloudClusterExtractor(),
        ClusterColorAnnotator()
    ]
)